
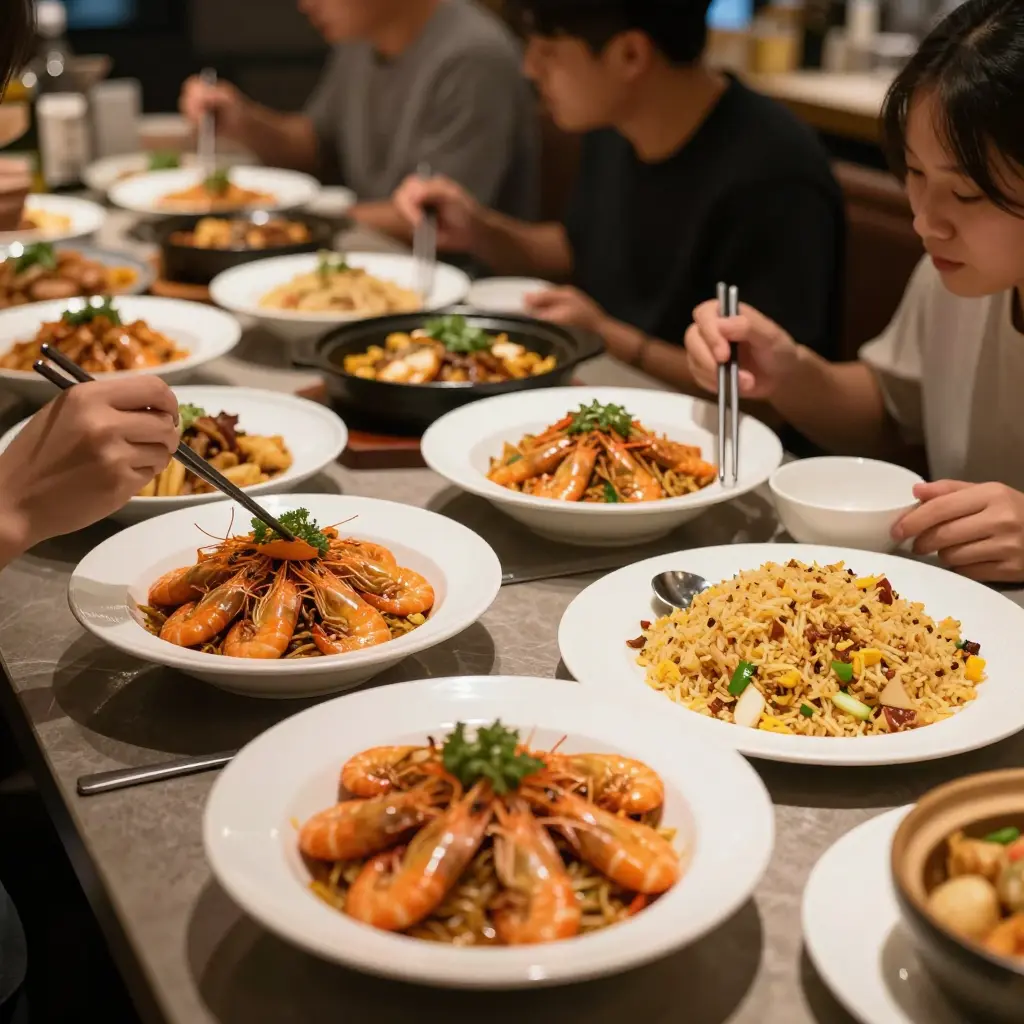
The Economics Behind a Full Plate
A Chinese buffet in Gainesville, Florida, sells a simple promise: pay one price, eat as much as you like. Behind it, every tray on the steam table is a running total of costs set miles away in wholesale markets. Owners set the price once and then defend it against ingredient costs they do not control and diners who compare them against every other buffet in town.
Shrimp shows this best. When shrimp gets more expensive, the effect moves through a menu faster than most customers notice, from how a cook portions a pan to which dishes come out of the kitchen.
A buffet is an unusually clear view of restaurant economics because the fixed price has to absorb every swing in supply. Diners see the sticker price; the rest of the story sits in portions, refill timing, and recipes.
Gainesville’s dining scene mixes long-running buffet operators, students on tight budgets, and families looking for value, and that mix keeps owners watching costs closely. For a sense of how these kitchens run day to day, see how a Gainesville Chinese buffet typically operates.
What follows is how shrimp prices reach the kitchen, and which small recipe adjustments follow.
Why Shrimp Prices Swing
Shrimp is one of the hardest line items on a buffet budget to predict. Its supply chain runs from Gulf trawlers to ponds in Asia and Ecuador, and several of its parts move independently.
Seasonality sets the baseline
Wild shrimp follow a natural calendar. In the Gulf, brown and white shrimp populations peak in the warmer months, when landings rise and wholesale prices soften. In the off-season, volume falls and prices firm up. The cycle repeats each year, but its size changes, so no two seasons match.
Farmed versus wild supply
Farmed shrimp from ponds in Asia and Ecuador supplies most of the global market, which usually smooths out the seasonal spikes. Farms have their own problems, including disease outbreaks and feed costs. When a major producing region has a bad cycle, farmed prices can swing as sharply as wild ones, so the two sources rarely cancel each other out.
Import tariffs and trade policy
Most buffet shrimp is imported, so tariffs matter. Duties change with trade disputes and anti-dumping rulings, and one policy decision can raise the landed cost overnight. Few substitutes can absorb that increase, so the pressure moves down the chain.
Fuel, freight, and Gulf conditions
Diesel runs the trawlers and the refrigerated trucks, so fuel prices feed straight into the delivered cost of every pound. Ocean freight rates for temperature-controlled containers rise and fall with global shipping demand. Closer to home, hurricanes, red tide, seasonal closures, and storm damage to gear can tighten Gulf supply within weeks.
How it shows up in cost per pound
For a Chinese buffet in Gainesville, Florida, these swings land on the item diners notice most. Shrimp is among the priciest proteins on the line, so a jump in cost per pound forces a quick recalculation. Some operators shrink portions, some switch to smaller counts, and many add more rice to the fried rice while keeping the plate looking full. The same pressures show up across the region, and the broader Gainesville buffet market traces how they play out in practice.
Shrimp price swings are not random. They are the surface of several overlapping forces, and a buffet’s cost per pound is where they all meet.
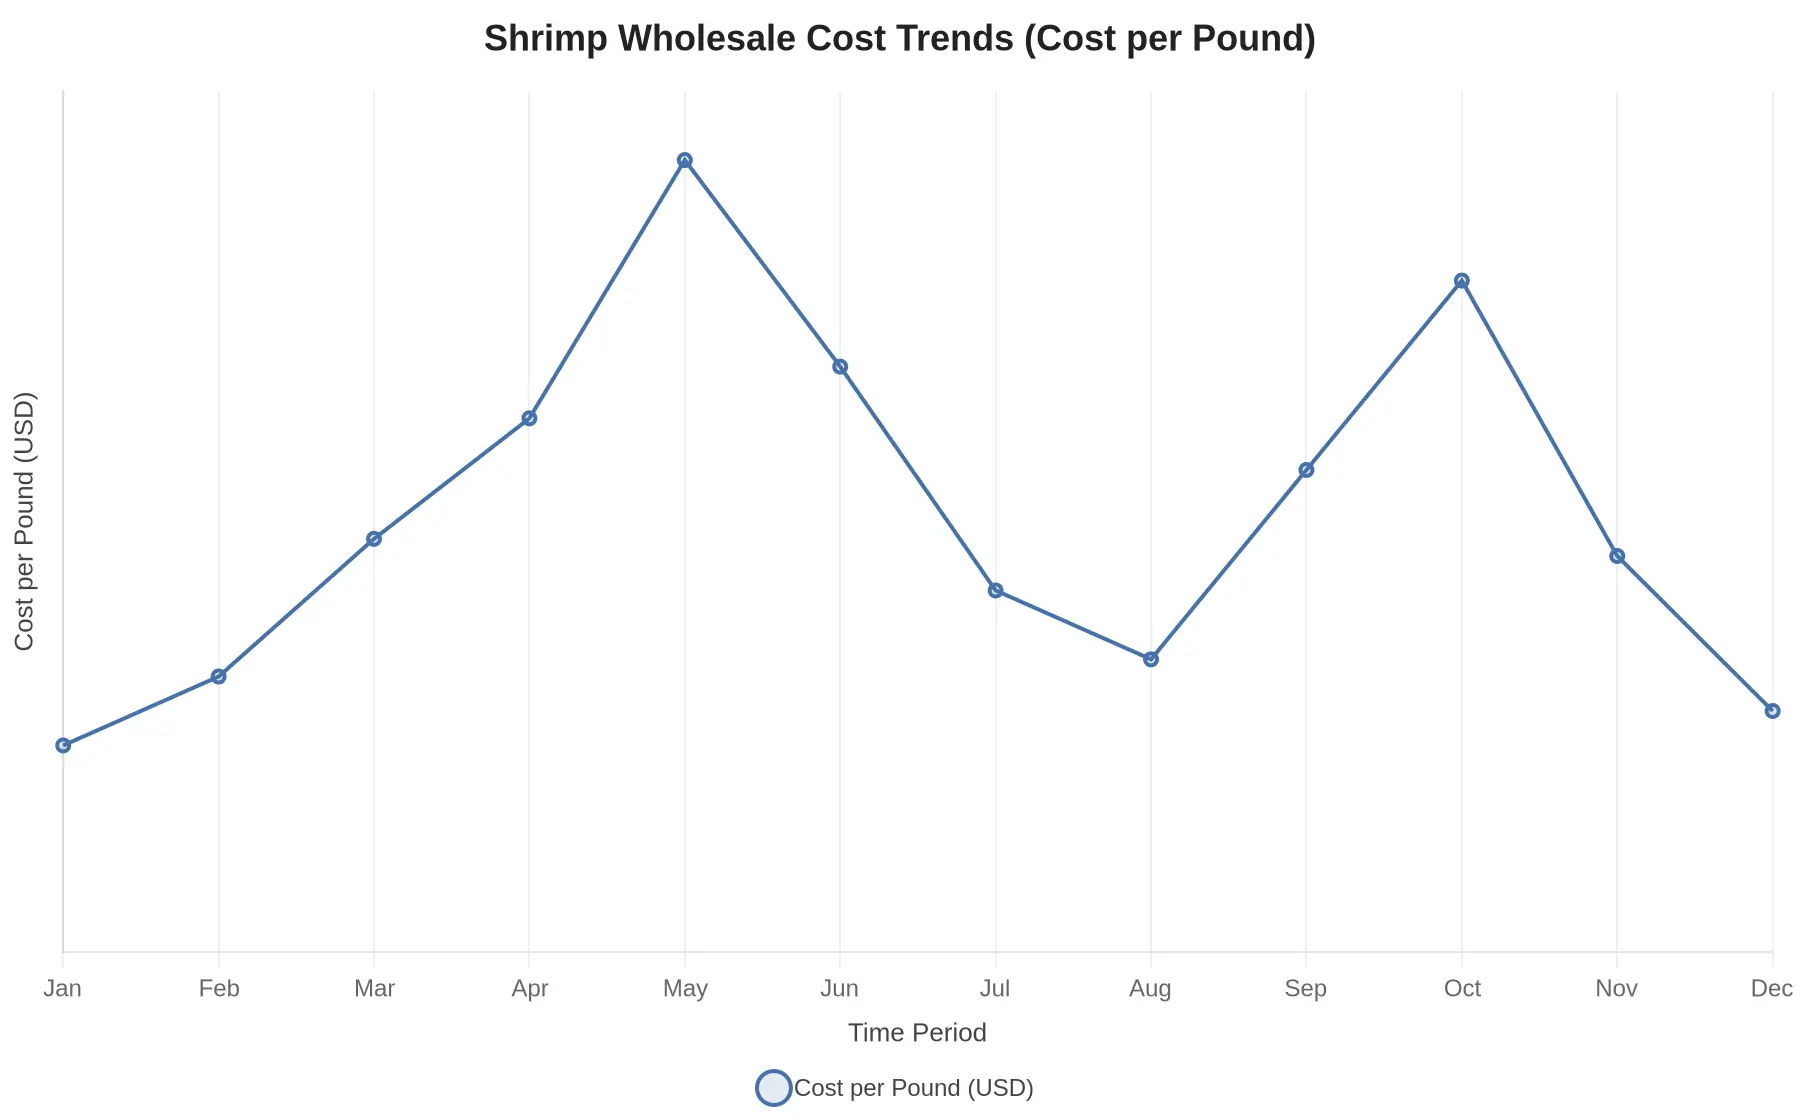
The chart above tracks wholesale shrimp costs from $5.20 to $8.60 per pound in a single year, a 65% rise from trough to peak. With swings that size, there is little room for an operator to wait and see, which is why the fried rice ratio moves before the printed menu does.
Why Fried Rice Changes Before the Menu Does
Before a price tag or a menu board changes, a buffet’s fried rice ratio has usually moved already. That ratio is the proportion of rice to add-ins such as shrimp, egg, and peas, and it is one of the first things an operator adjusts when ingredient costs change. Diners rarely notice, but it decides the cost of every scoop.
The logic behind buffet recipe adjustments
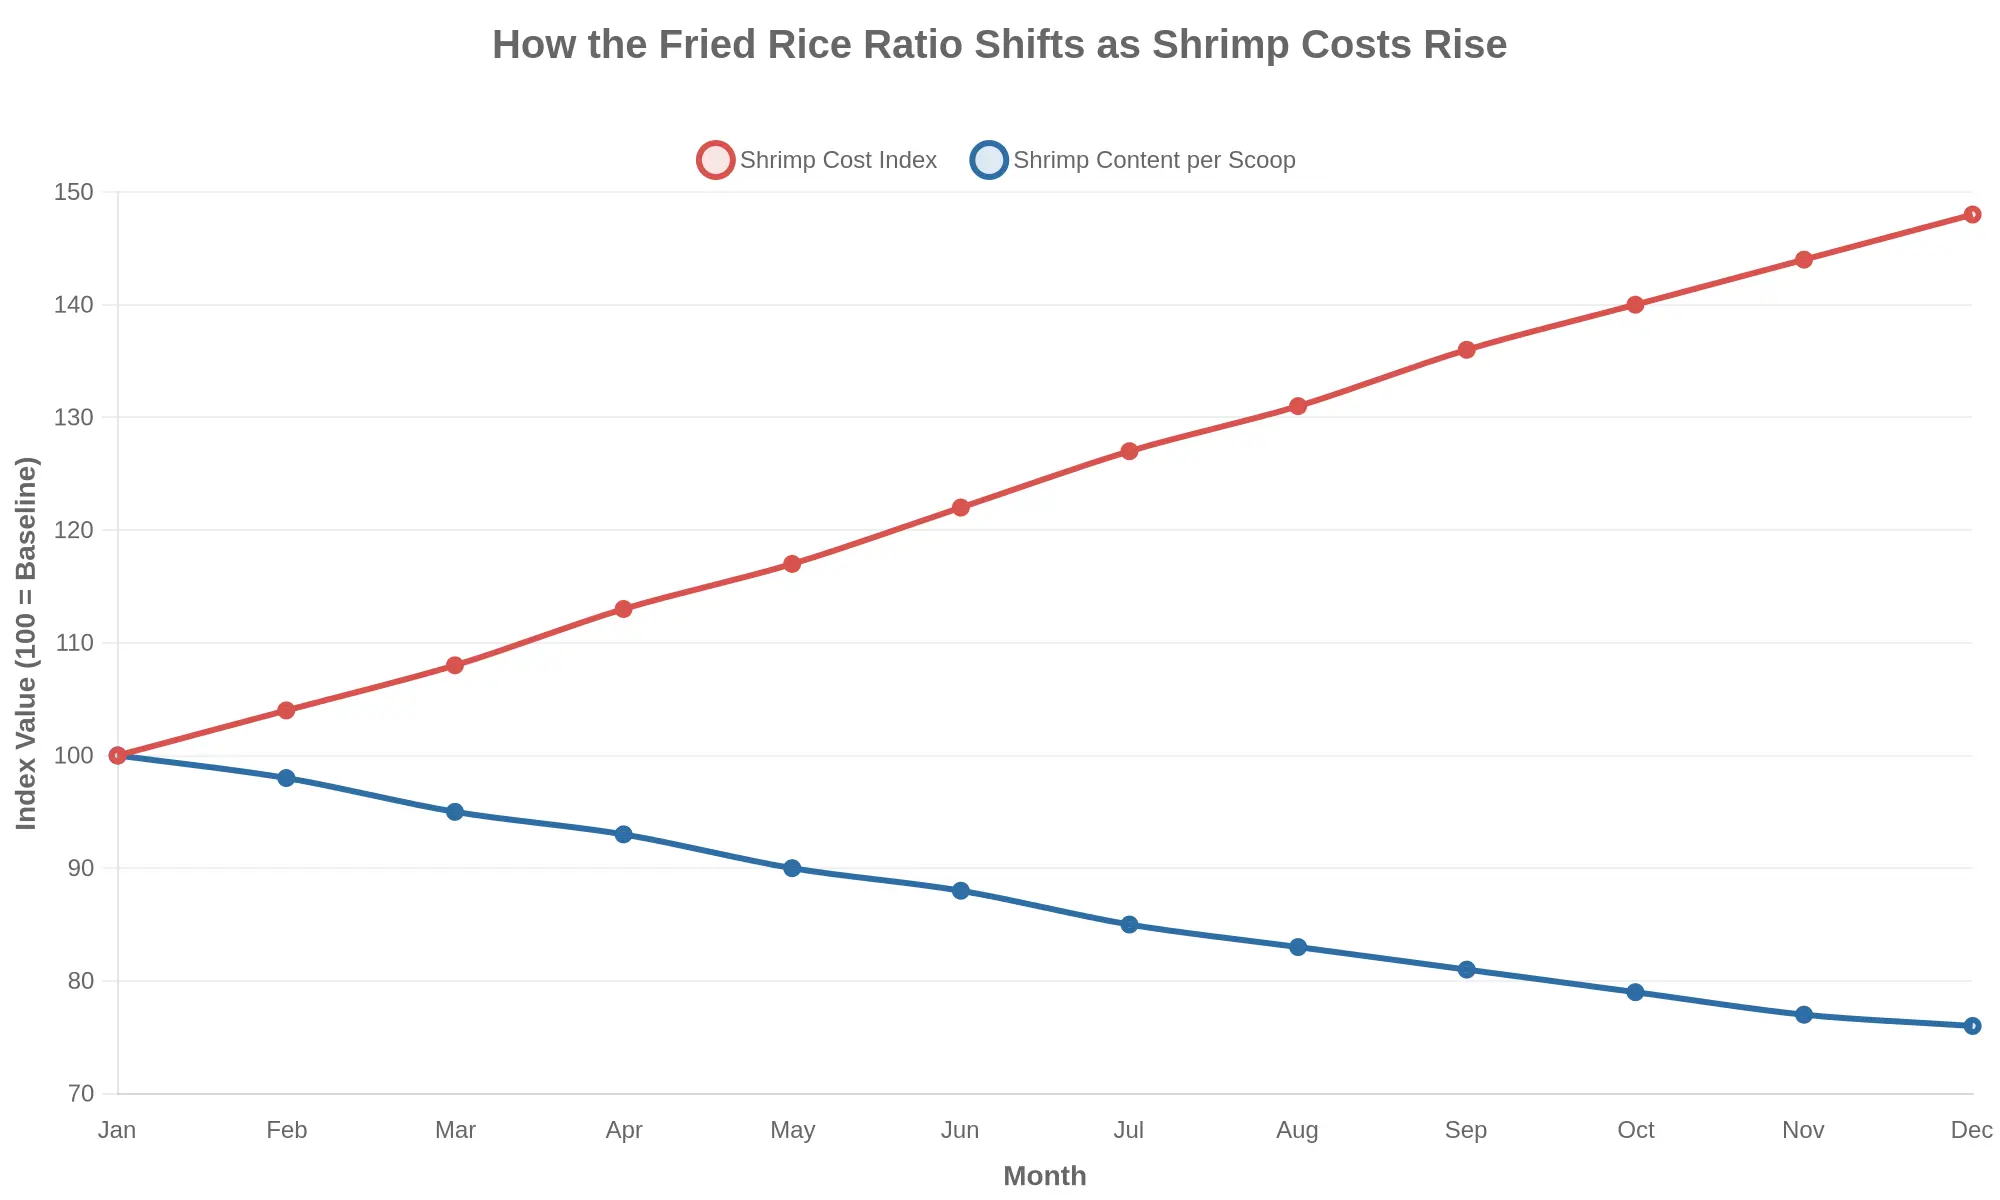
When shrimp prices climb, most operators do not pull shrimp fried rice off the line. Removing it signals trouble and annoys the regulars who came for it. Instead they stretch the expensive ingredient and lean on cheaper fillers: less shrimp, more rice, a few extra eggs, and a heavier hand with frozen peas and diced carrots. The pan still looks full and still tastes like shrimp.
The math is simple. Rice, egg, and peas cost pennies a serving; shrimp costs many times that. A small shift in the ratio cuts real cost from every scoop without changing a word on the menu. Across hundreds of servings a day, the savings add up and the posted price stays where it is.
Why locations adapt differently
How far a kitchen pushes that ratio depends on local shrimp costs, labor, and how price-sensitive its customers are. In Gainesville, Florida, where diners expect a lot of value and shrimp prices move with the season, the fried rice ratio is a real management tool, not an afterthought. Some locations hold the line on shrimp and trim elsewhere; others rebalance the pan more aggressively. How individual spots adjust their own buffet formulas shows that variation from one location to the next.
Timing explains it. Prices and menus are visible, slow to change, and heavy with signal. The fried rice ratio is invisible, fast, and easy to adjust, so it moves first.
The table below ranks ingredients by how much their cost moves, and what operators do when wholesale prices rise (a closer look at how Gainesville Chinese buffets manage those swings).
| Ingredient | Cost Volatility | Typical Role in Buffet Lineup | Adjustment Strategy When Costs Rise |
|---|---|---|---|
| Shrimp | High | Premium centerpiece; drives perceived value and traffic | Shrink portion sizes, blend into fried rice, reduce refill frequency, or cycle off the hot bar first |
| Chicken | Medium | High-volume anchor protein in stir-fries, wings, and General Tso’s | Substitute cheaper cuts, lean on dark meat, and stretch sauce-to-meat ratios |
| Pork | Medium | Budget workhorse in dumplings, ribs, and stir-fries | Shift toward fattier or bone-in cuts, boost in dumpling and rice fillings |
| Frozen vegetables | Low to Medium | Filler and volume builder in stir-fries, soups, and mix-ins | Swap to seasonal or bulk staples; absorb cost silently since diners rarely notice |
| Rice | Low | Cheap bulk base for fried rice and every side plate | Hold the line; rice is the buffer that soaks up slack from pricier proteins |
| Eggs | Medium to High | Binder and protein in fried rice, omelets, and custards | Trim the fried rice egg ratio; replace with cheaper add-ins to protect the base |
| Cooking oil | High | Essential fryer and wok medium across the whole line | Cut deep-fried items, switch to baking or steaming, and buy in bulk contracts |
Read top to bottom: the more volatile the ingredient, the sooner recipes and the lineup change, usually before diners see anything.

The diagram above traces one path: a rise in shrimp cost reaches the recipe first, reshaping the fried rice ratio, and only later reaches the menu or the price. Gainesville buffet kitchens absorb most of that in the back of house before a diner notices anything.
How Buffet Pricing Actually Works
A buffet’s sticker price looks like the simplest number in the business: one flat charge, unlimited trips, no math at the table. Behind the counter, it is the result of constant recalculation.
The fixed price point
Nearly every buffet runs on fixed, all-you-can-eat price tiers: lunch, dinner, and sometimes a weekend seafood night. Owners keep those numbers stable because diners anchor to them. A buffet that changes its sign every few weeks teaches customers to wait for a deal instead of coming in hungry on a slow Tuesday.
So the price tends to hold, and operators adjust what sits behind the glass. In buffet pricing, the menu is the flexible part, not the number on the door. For a regional comparison, all-you-can-eat Chinese buffets around Jacksonville show how price tiers and seafood nights differ from one neighborhood to the next.
Plate counts and food cost targets
The core math is average consumption per plate multiplied by the number of plates. A buffet estimates how much a typical guest eats and works backward to a cost per head. Most aim for a food cost percentage in the low-to-mid 30s, the share of each dollar that goes back into ingredients. A la carte restaurants often target 28-30% because the kitchen controls the portion. At a buffet the guest controls it, so the target rises to absorb the uncertainty.
| Cost category | Typical share of revenue |
|---|---|
| Food (ingredients) | 30-38% |
| Labor | 25-30% |
| Waste & replenishment | 3-6% |
| Rent, utilities, overhead | 20-25% |
| Remaining margin | 5-12% |
Waste and replenishment
Buffets carry a cost most restaurants do not: looking full. Trays have to stay stocked, which means cooking ahead of demand and discarding what sits too long under the lamp. Waste and replenishment usually add another 3-6% on top of ingredient costs.
Why buffets have less room to react
When shrimp cost spikes, an a la carte kitchen can raise the price of one dish or shrink the portion. A buffet cannot re-price a single tray without re-pricing the whole meal. It protects the flat price by rebalancing the spread: more fried rice, smaller shrimp, fewer premium nights. Regulars tend to notice that before the menu changes.
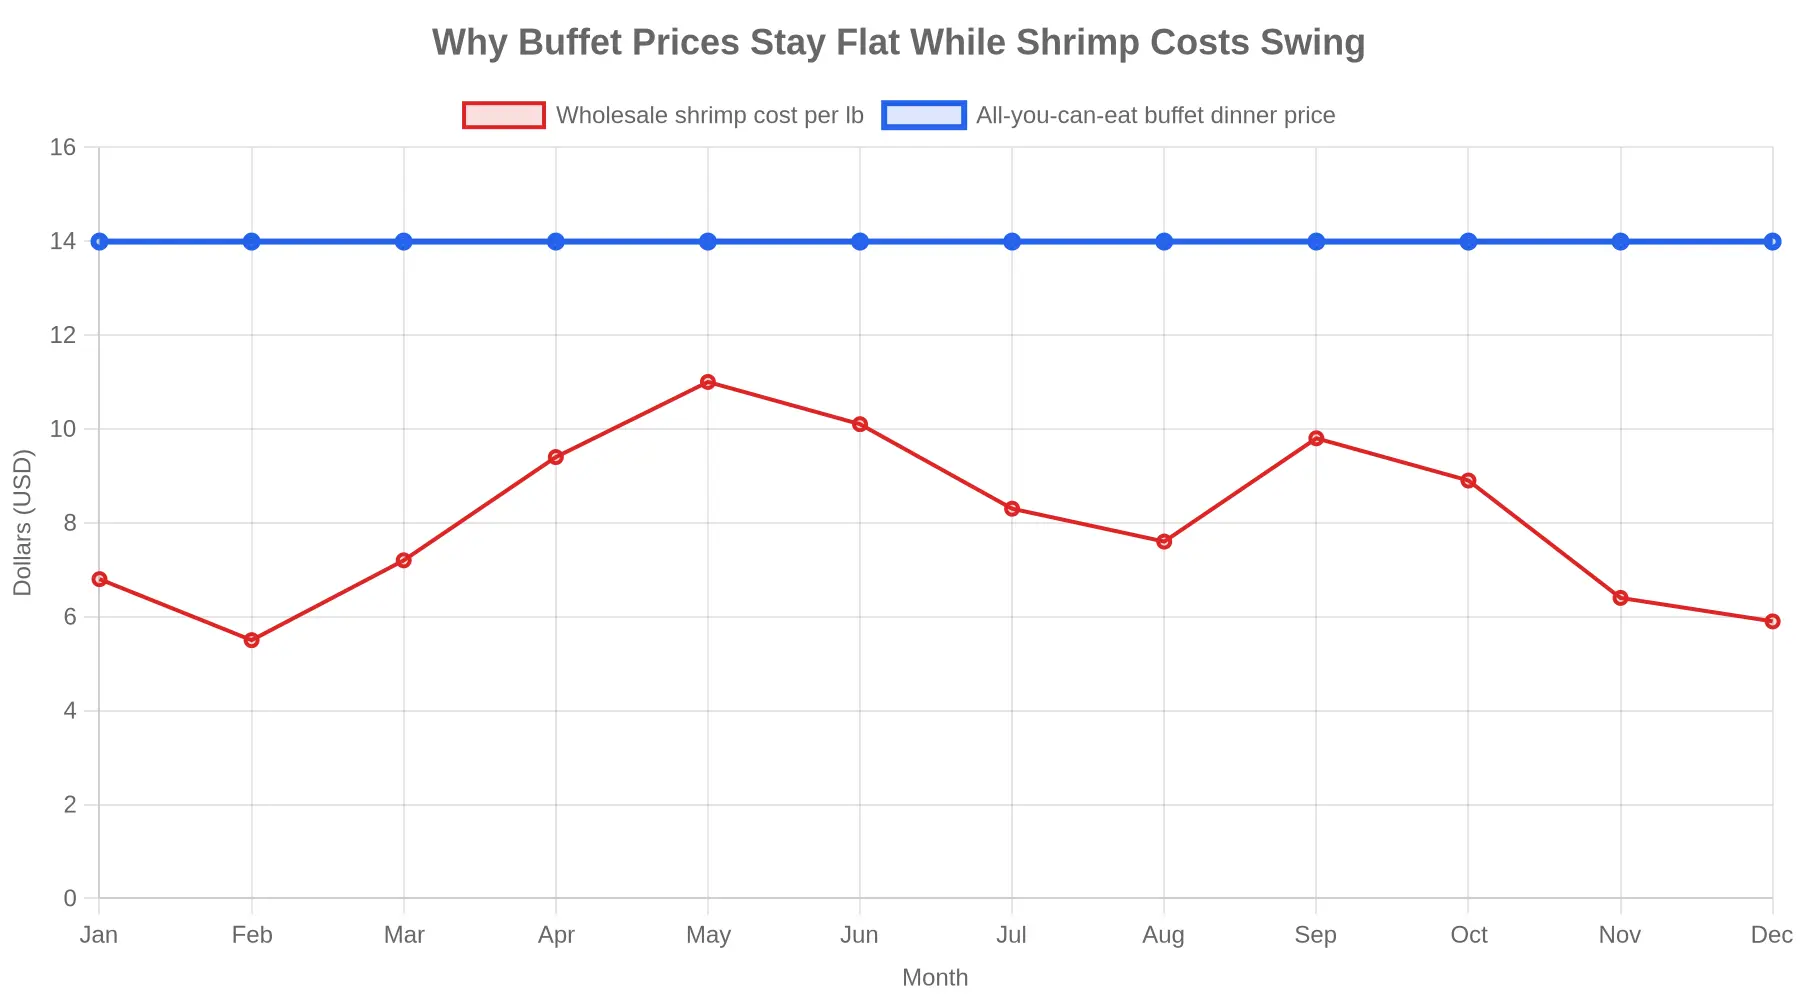
That is the tension in buffet pricing: hold a familiar number for diners while protecting margins that were thin to begin with. The chart above shows it: one line for shrimp that swings hard, one line for the door price that barely moves.
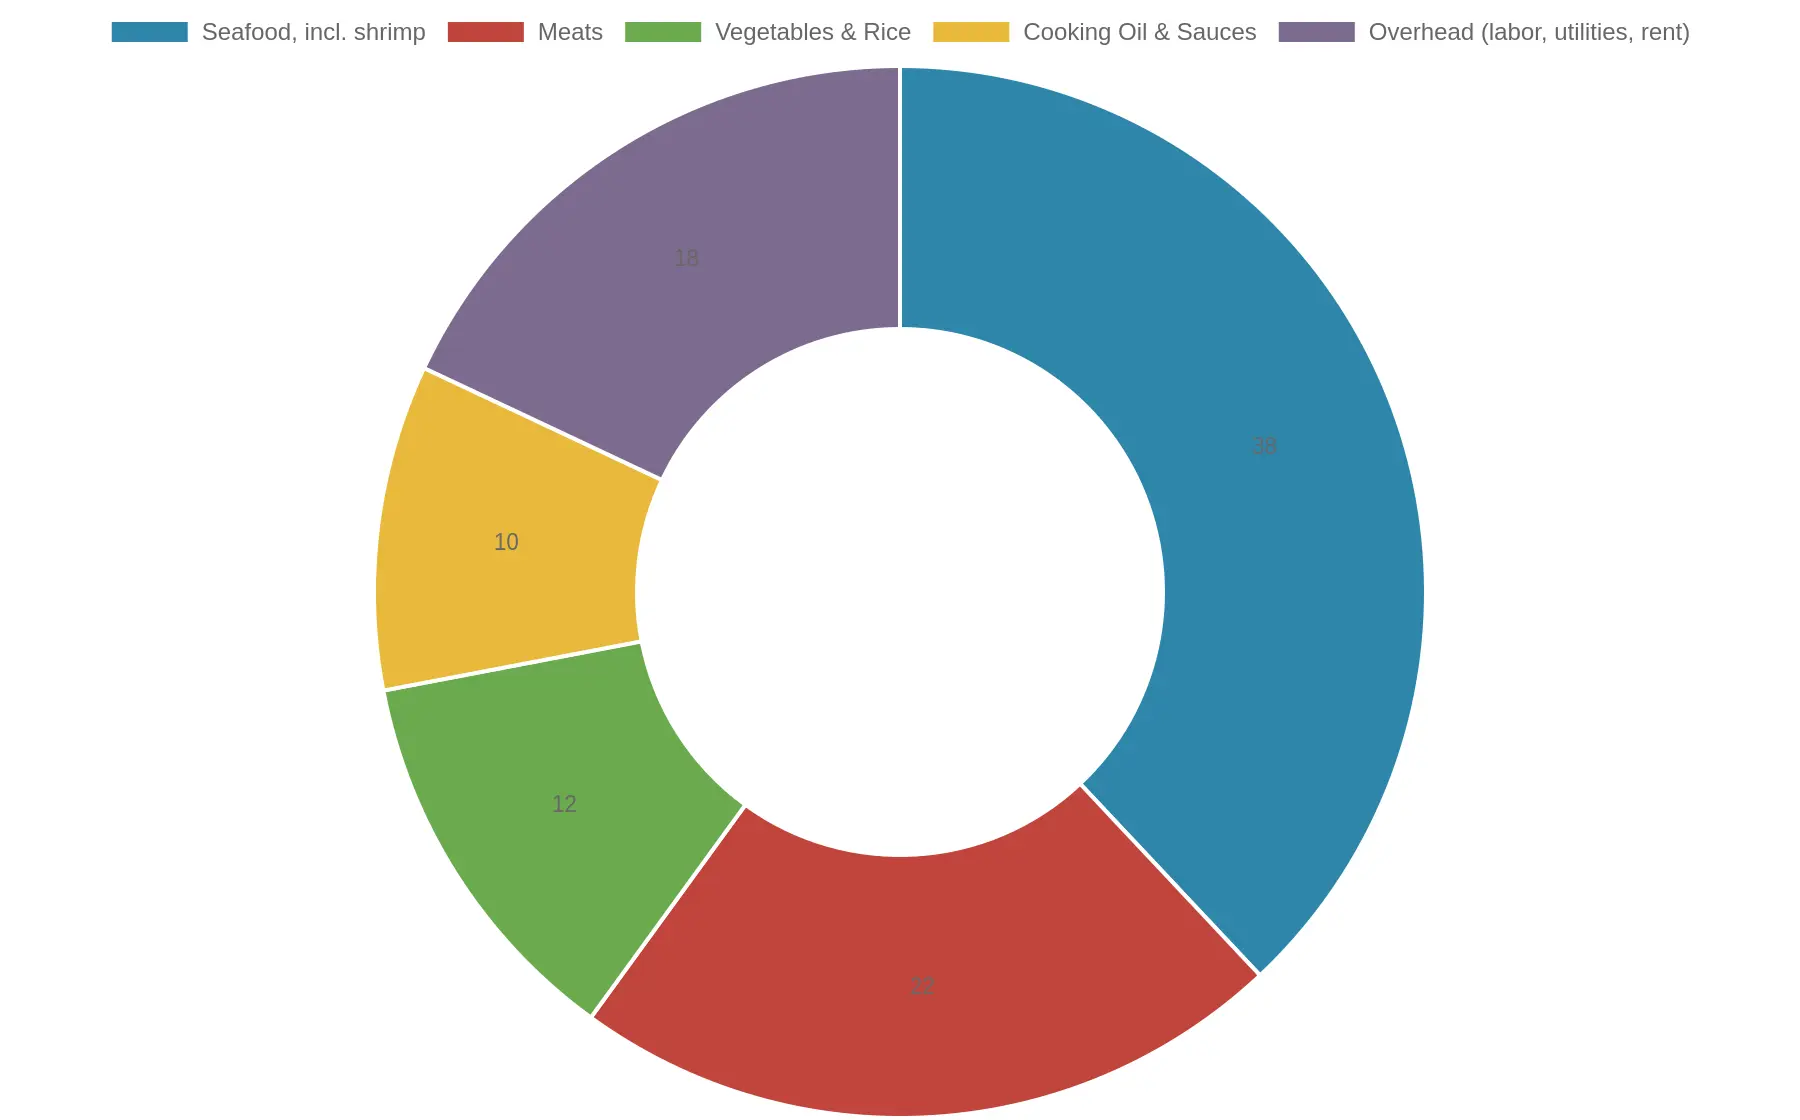
Estimated cost composition of a typical buffet plate – Seafood, incl. shrimp: 38% · Meats: 22% · Vegetables & Rice: 12% · Cooking Oil & Sauces: 10% · Overhead: 18%
What the doughnut chart shows
The things that fill a plate most are usually the cheapest things on it. Rice and vegetables together account for about 12% of what a plate costs to put out, while meat and seafood carry the bill. Seafood, mostly shrimp, is roughly 38% of the cost even though a scoop of shrimp takes up very little space on the plate.
That mismatch is the point. Shrimp trades like a commodity, so when its price spikes the cost structure tilts toward that one protein. Rice is cheap by comparison, which makes stretching the fried rice ratio the easy fix: more rice, less of the pricier add-ins, long before anyone touches the printed menu. The plate barely changes. The math behind it changes every week.
Practical Takeaways for Buffet Owners and Curious Diners
Whether you run a buffet or just eat at one, the shrimp-and-fried-rice relationship shows how ingredient costs work behind the scenes. Here is how to use it.
For Independent Buffet Owners and Operators
- Track shrimp cost weekly, not just when it hurts. Log your landed price per pound so you can see where the market is heading before it eats into your margin.
- Move the fried rice ratio gradually. A few percentage points per batch goes unnoticed; a sudden change does not. Small adjustments protect both your food cost and your reputation.
- Show value through variety and freshness. A fuller, more colorful line reads as generous even when portions are trimmed.
- Expect recipes to change before menus do. The fried rice ratio often shifts weeks before a dish appears or disappears, so watch your ingredients, not just your printed menu.
For Curious Diners
- When a familiar item changes, it usually reflects cost pressure, not a drop in quality.
- Reading the line takes practice. Seasonal appearances and disappearances show what is affordable that month.
- Watch for shrimp moving from lunch to dinner or shrinking in size. That is the shrimp cost trend on your plate.
Quick Reference
| Decision Point | What Owners Watch | What Diners Can Read |
|---|---|---|
| Shrimp cost | Weekly landed price per pound | Fewer or smaller shrimp, or shrimp shifted to dinner |
| Fried rice ratio | Shrimp-to-rice percentage per batch | Rice looks richer in vegetables, lighter on shrimp |
| Menu timing | Lag between recipe tweaks and visible changes | New items appearing and disappearing with the seasons |
For anyone running a Chinese buffet in Gainesville, Florida, the sequence is consistent: cost trends move first, recipes adapt second, menus last. Diners see the same pattern from the other side of the glass. Florida’s regional buffet patterns show how that pressure lands differently from market to market.
What the Buffet Line Tells You
By the time a written menu changes, most of the decisions have already been made behind the sneeze guard. The shrimp cost, the price of a case of rice, the weekly quote from the seafood supplier: all of it is absorbed in the kitchen before a diner notices anything different on the plate.
The buffet line is an economic instrument. When shrimp prices climb, the peel-and-eat tray may get smaller, or the fried shrimp may move from a centerpiece to a lighter portion. When rice gets cheaper relative to protein, the fried rice ratio tilts: a little more grain, a little less shrimp, and the dish still tastes right. The menu stays put. The math underneath it does not.
Once you see it, a buffet is easier to read. A thinner shrimp pile is not decline; it is a response to the market. Extra fried rice is not filler; it is a cost decision you can see. The Chinese buffet in Gainesville, Florida, is a useful local example, with prices, portions, and recipes that follow supply rather than announcements.
So the next time you fill a plate, look past the ladle. An all-you-can-eat spread is a running balance of ocean freight, harvest seasons, and grain prices, settled one serving at a time. The menu is the last place those changes show up, and usually the first place diners look.