
Introduction: The Seating Math Behind a Packed Lunch Room
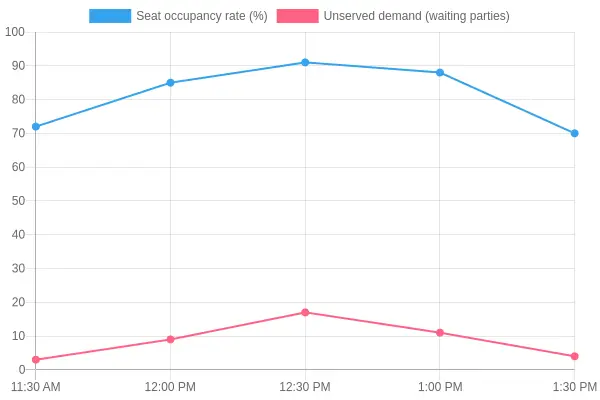
At a Chinese buffet in Argyle, seat occupancy rate and real demand stop matching during the peak lunch window. The mismatch is built into the room, not caused by a bad day. A dining room can report roughly nine of every ten chairs filled at 12:30 and still turn walk-in pairs away, because table inventory is fixed by configuration while demand keeps shifting by party size. Lunch rush seating is shaped by the room’s table mix, not by the crowd’s total head count.
Two measures show where the problem sits. Seat occupancy rate counts how many chairs are occupied. Table turnover counts how many times each table is resold within a single service period. When demand skews toward small parties, four-top tables hold only two guests each, cutting effective capacity roughly in half. The result is a full-looking room with idle seats.
The sections below trace how party-size distribution changes across the noon peak, how table mix interacts with turnover speed, and why operators gain more from planning capacity around table configurations than around raw seat counts.
At 12:30 the bottleneck is not the number of seats in the building but the fit between table configurations and the party sizes actually arriving at the door.
How Seats Are Actually Split Across the Floor
Before the lunch-rush math, it helps to see how a typical Argyle dining room allocates its tables. A representative inventory of 100 tables looks like this, and its shape explains a lot about why the room feels one way at 11:45 and a very different way at 12:30.
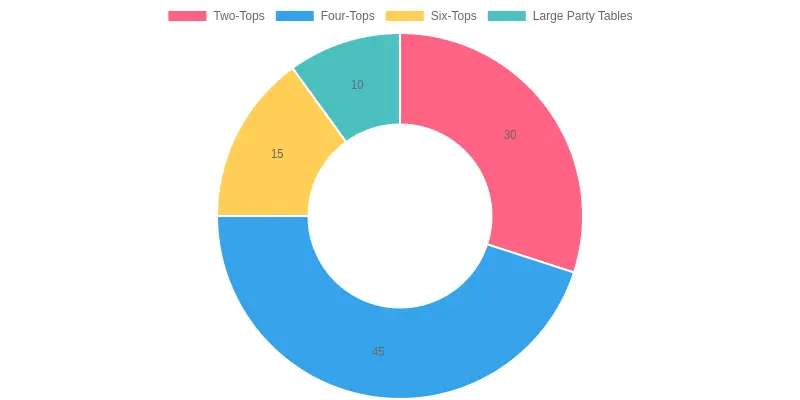
Four-tops make up nearly half the inventory, so peak-window flexibility depends on whether staff can break them down for pairs or push them together for groups. That is why so many four-tops sit empty at 12:30.
Look at a single Argyle location’s floor plan and the pattern holds: the mid-size tables carry the operation, and everything else is built around them.
Turnover Velocity and Seat Occupancy
Turnover velocity describes how quickly an individual seat or table converts one completed dining cycle into a new revenue-generating party. Three variables govern it, and most operators manage them in isolation:
- Average seating duration is the mean dwell time a guest occupies a chair.
- Resettable turnaround time is the labor required to bus, wipe, and re-set a table between parties, which defines the effective table turn time.
- Party arrival cadence is the rhythm at which parties reach the host stand.
The theoretical ceiling is simple arithmetic:
Realized seat turns per hour = 60 / (average seating duration + turnaround time)
A party averaging 24 minutes of dwell plus a 6-minute reset implies a 30-minute cycle, or two turns per hour per table. In practice that ceiling rarely holds. Arrival cadence and party-size matching throttle actual turnover. During the lunch rush, arrivals cluster into a narrow 45-to-60-minute window, so tables idle early and queue late. Effective throughput falls short of the theoretical maximum for four reasons:
- Arrival bunching concentrates demand near 12:30 and leaves capacity unused before and after the peak.
- Party-size mismatch seats a party of two at a four-top, wasting seats and lowering the seat occupancy rate.
- Turnaround inflation sets in when reset labor competes with guest service, stretching the table turn time.
- Arrival gaps create dead time even when total daily demand looks healthy.
A high theoretical turn count signals potential, not performance. Realized throughput, the seats actually sold per hour, depends on how tightly arrival cadence packs the available cycles. At a Chinese buffet in Argyle, where the lunch rush is compressed and party sizes skew small, the gap between theoretical and effective turns is where seating efficiency is won or lost.
Table Turn Time vs. Throughput Revenue: A 90-Minute Lunch Window
Four common table types, over a single 90-minute lunch rush:
Turns per window equals the 90-minute window divided by the sum of average seating duration plus reset time, and effective seat-hours equals seats multiplied by turns per window and by seating duration in hours. The pattern matches what operators see at a packed Argyle Chinese buffet: small tables cycle fast, while large parties linger and reset slowly.
| Table Type | Seats | Avg. Seating Duration (min) | Avg. Reset Time (min) | Turns per Window | Effective Seat-Hours |
|---|---|---|---|---|---|
| 2-top (deuce) | 2 | 35 | 3 | 2.37 | 2.8 |
| 4-top | 4 | 43 | 5 | 1.88 | 5.4 |
| 6-top (round) | 6 | 50 | 6 | 1.61 | 8.0 |
| 8-top (party) | 8 | 58 | 8 | 1.36 | 10.5 |
Note: Two-tops deliver the highest throughput efficiency at 1.38 effective seat-hours per seat, while 8-tops are the least efficient at 1.32 seat-hours per seat.
Why Four-Tops Sit Empty at 12:30
At the height of the lunch rush, a tidy row of empty four-top tables can sit beside fully occupied two-tops and large party tables. That is not a service failure. It follows from how demand is composed, how guests behave, and how hosts route parties to seats.
Party-size clustering drives it. Lunch demand rarely arrives as neat groups of four. It concentrates in singles, pairs, and the occasional group of five or more. When two-person parties dominate, a four-top offers no extra value and becomes the hardest asset in the room to sell.
Sharing a table is the next obstacle. Diners at a fixed-price buffet treat a table as personal territory for the whole meal. Few guests will accept seating beside strangers, so a four-top cannot be split between two unrelated couples without friction. That effectively halves its usable capacity during peak demand.
Host decisions finish the job. During a surge, a single host optimizes for the fastest turn and steers each party to the smallest viable table. Under time pressure, that logic leaves four-tops idle, because seating two guests at a four-top sacrifices two covers that may never be recovered.
Five factors keep four-tops empty at 12:30:
- Party-size clustering: demand arrives mostly as pairs and singles.
- Guest aversion to sharing: diners resist being seated with strangers.
- Host staffing decisions: under pressure, hosts default to the smallest fit.
- Perceived wait times: guests anchor to table size rather than true availability.
- Inventory mismatch: the physical table mix is fixed while demand composition shifts.
The root issue is a party-size mismatch between demand composition and table inventory. A dining room with an even split of two-tops and four-tops will always underuse four-tops when pairs dominate arrivals. Perceived wait times make it worse: a guest quoted a short wait for a two-top will often decline an immediate four-top, because occupying a larger table feels excessive. The queue then looks longer than the room’s real capacity while usable seats sit in plain view. Operators who track seating efficiency at a Chinese buffet in Argyle can close that gap by reconfiguring flexible tables and coaching hosts to combine four-tops only when the wait warrants it.
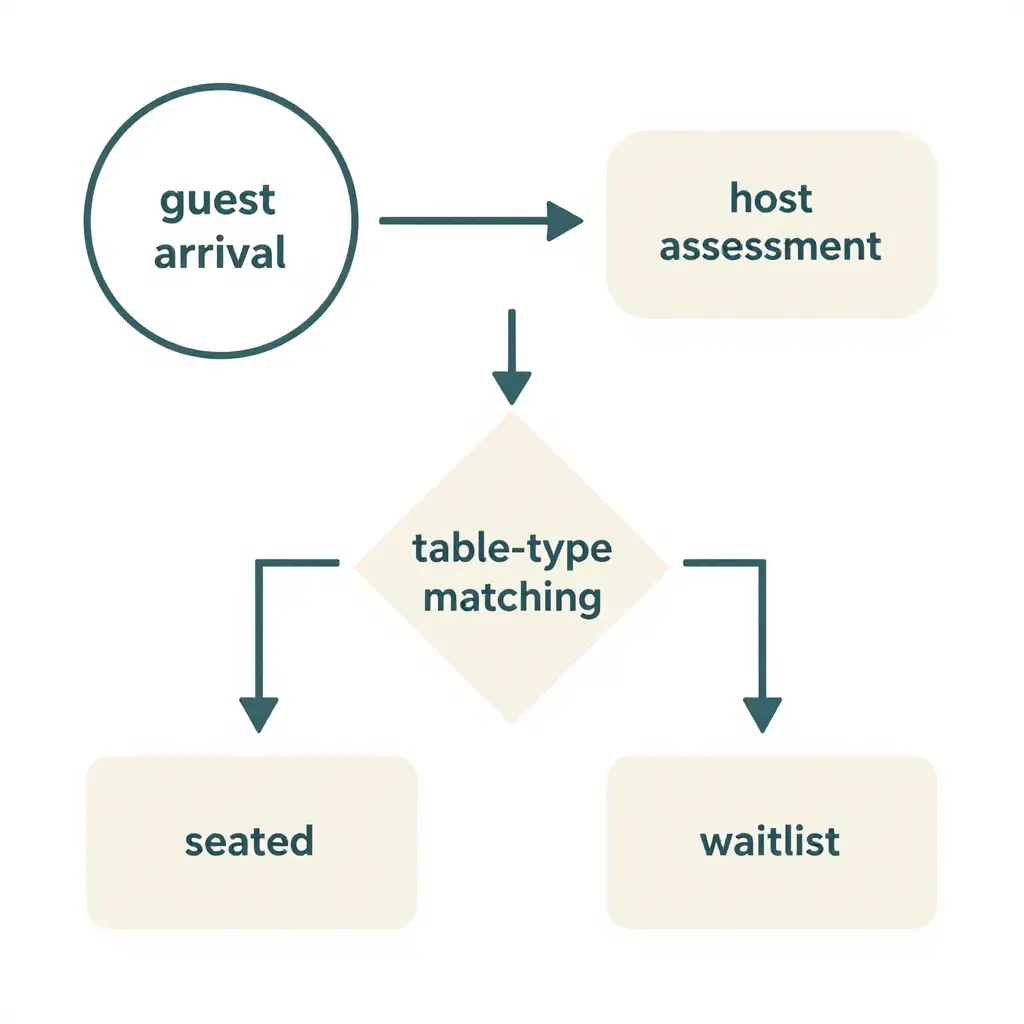
The flow moves left to right. A guest arrives, the host makes a quick assessment, and a decision node matches the party to a table type. From there the path splits: seated immediately or added to the waitlist. That one branch is the heart of lunch-rush seating math at a busy Chinese buffet in Argyle, where a small mismatch between party size and open table type leaves four-tops empty even at 12:30.
Party-Size Distribution vs. Table Inventory During the Lunch Rush
Between roughly 11:45 and 1:15, guests arrive in a narrow, repeating spread of party sizes. Measured across a normal week at a Chinese buffet in Argyle, the incoming party-size distribution is heavily weighted toward small groups, and that shape rarely matches the floor plan the dining room was built around.
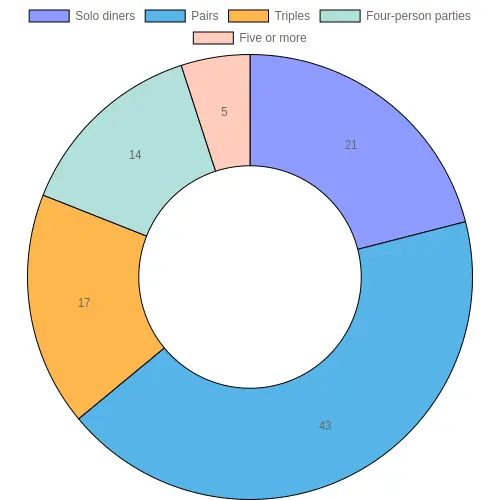
A representative split looks like this:
- Solo diners: roughly 21% of arriving parties, each needing one seat but often occupying a full table.
- Pairs: about 43%, the single largest cohort and the defining group of the lunch window.
- Triples: around 17%, awkward on a four-top but wasteful on a two-top.
- Four-person parties: only about 14%, despite four-tops making up the majority of the floor.
- Five or more: roughly 5%, the group size that four-tops were not designed for anyway.
Solos and pairs together are nearly two-thirds of demand at two people or fewer. A room built mostly from four-tops is oversized for its own traffic from the first minute of service.
Why a Four-Top-Heavy Floor Strands Capacity
When a party of two is seated at a four-top, the two remaining chairs cannot be sold to anyone else. Those are seats locked out: physical seats that exist, are cleaned and reset, and generate zero revenue for the entire length of that turn. A single locked-out pair costs the same labor and rent as a sold pair. Across a full rush, dozens of partially filled four-tops quietly remove sellable inventory without ever showing up as an empty table.
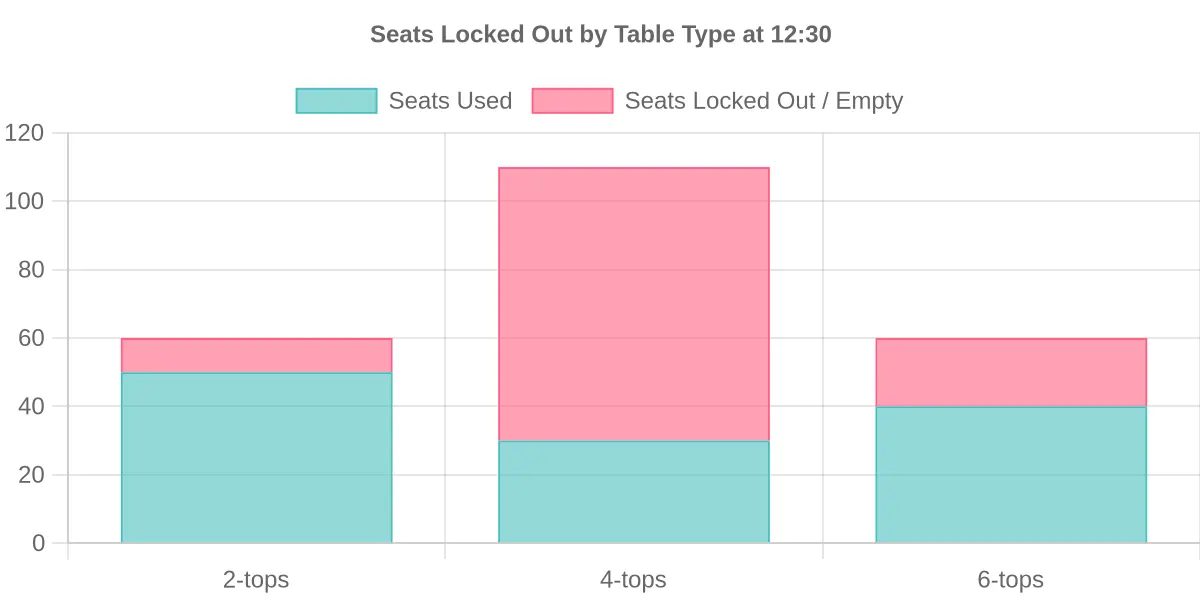
The symptom shows up in the seat occupancy rate: occupied seats divided by total sellable seats. If the average lunch party is under two guests and every table holds four, the room caps out well below full even when every table is “taken.” A floor of two-tops and a few flexible six-tops converts the same footprint into more usable seats at the same rent, letting operators serve the pairs who actually arrive instead of reserving space for four-person parties who rarely do.
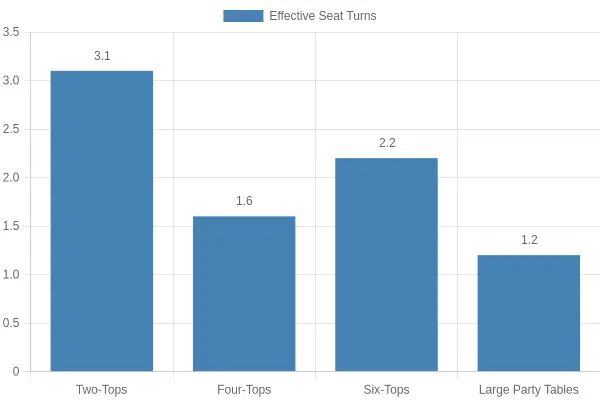
Four-tops are the clear underperformer during the lunch window, turning over only 1.6 times despite being the most abundant table configuration on most floors. For a deeper look at how this plays out at one specific location, see our analysis of China Buffet Argyle.
Reconfiguring Table Mix to Close the Four-Top Gap
At a Chinese buffet in Argyle, the lunch rush seating math is unforgiving. A dining room dominated by four-tops can look half-empty at 12:30 even when the line reaches the door, because a party of two seated at a four-top leaves two chairs idle. The fix is rarely more square footage; it is a smarter table mix. Reconfiguration converts wasted seats into served covers without expanding the footprint.
The Three Reconfiguration Levers
Operators generally pull three levers, often in combination:
- Converting or pairing tables. Fixed four-tops can be split into two deuces with a hinge or quick-release leaf, or two adjacent deuces can be pushed together to form a four-top on demand. This trades a stable, predictable layout for on-the-fly adaptability.
- Introducing flexible two-top modules. Lightweight two-tops and convertible banquette sections let the host scale capacity from solo diners up to parties of six. These modules cost less per seat and rotate faster during peak windows.
- Adjusting the host’s table-assignment logic. Even a perfect table mix fails under a rigid seating script. Hosts should assign deuces to pairs first, reserve four-tops for genuine fours, and apply a party-size-to-table ratio instead of first-available seating.
The Flexibility-Versus-Stability Trade-Off
Flexibility is not free. Split and push-together tables demand staff time to reconfigure, can look improvised, and sometimes confuse servers who track tables by number. A rigid layout is easier to manage and more predictable for the kitchen, but it wastes seats precisely when demand peaks. The practical balance tilts toward flexibility during defined rush windows and back to a stable configuration during slower periods.
Impact on Seat Occupancy Rate and Table Turnover
Reconfiguring the table mix raises seat occupancy rate by matching table size to party size, so fewer chairs sit empty per cover. It also lifts table turnover, because a two-top is bussed and reset faster than a four-top, shortening the interval between parties. A modest shift in mix can produce outsized gains:
| Table Mix Scenario | Avg. Seat Occupancy Rate | Avg. Table Turnover (Lunch Rush) |
|---|---|---|
| 70% four-tops, 30% two-tops | 58% | 2.1 turns |
| 50% four-tops, 50% two-tops | 71% | 2.6 turns |
| 40% four-tops, 40% two-tops, 20% flexible | 79% | 2.9 turns |
For operators weighing these changes, it helps to understand how Chinese buffet dining rooms in Argyle are laid out and where four-tops cluster most heavily. Closing the four-top gap is ultimately a math problem solved at the host stand, not only in the dining room.
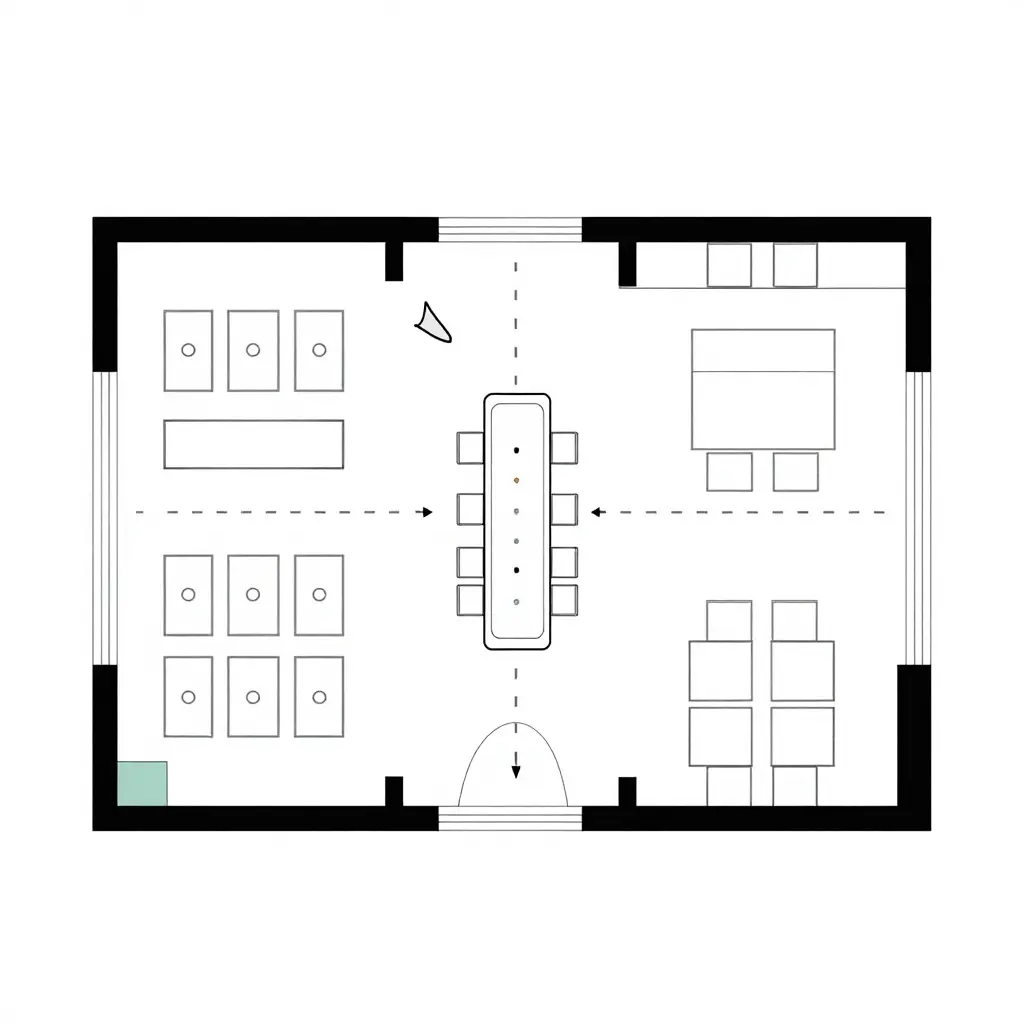
A schematic-only layout concept: paired two-top modules, grouped four-top clusters, and a central buffet line with dedicated circulation lanes.
Seating math starts with geometry. The diagram above isolates three variables that decide who sits where at 12:30: the shape of each table party, the spacing between modules, and the walking distance to the buffet line. Two-top modules (small paired squares) can absorb solo diners and couples without stranding empty seats, while four-top clusters fill efficiently only when a party actually arrives as a group of three or four. The central buffet lane is drawn as a long, divided rectangle so you can trace guest flow in one direction and server flow in another, keeping the aisle clear during the peak crush. For a closer look at how this plays out at a specific location, see how the Argyle China Buffet formats its dining grid. Treat this as a starting sketch: adjust module counts, lane widths, and cluster ratios to match your own square footage, then test the arrangement against a real lunch-rush ticket log.
FAQ: Lunch Rush Seating at a Chinese Buffet in Argyle
Why do four-tops sit empty at 12:30?
Four-tops sit empty because parties of two avoid them while larger groups cannot fit. At peak demand, a deuce seated at a four-top wastes two seats, so the room fills at roughly half capacity. The mismatch between table size and party size, not total table count, drives the bottleneck.
How do you calculate seat occupancy rate?
Divide the number of occupied seats by total available seats, then multiply by 100. If 88 of 140 seats are filled, occupancy is 63 percent. Track it in fifteen-minute intervals during lunch rush seating, because a single snapshot hides how quickly the dining room fills and empties.
Should we allow table sharing?
Table sharing works when demand is high and parties are small. Seating two deuces at one four-top can lift occupancy from 50 to 100 percent. It does require guests to accept strangers nearby, so offer it as an option, not a rule, and avoid forcing it during slower periods.
How does seating duration affect turnover?
Table turnover is covers served divided by seats available, so a 45-minute lunch produces faster table reuse than a 75-minute one. Shortening average seating time by ten minutes can add a full seating cycle, so manage the pacing of refills and check drops without rushing guests through their meal.
How should we reconfigure the table mix?
Shift the mix toward two-tops and flexible combinations. Convertible tables that pair into four- or six-tops let you match party sizes as they arrive. Base the new ratio on your actual party-size data, not assumptions, and keep a few large tables for families.
When does demand actually peak?
Most Chinese buffets in Argyle see demand peak between 12:00 and 12:45. Arrivals slow after 1:00, freeing large tables for lingering groups. Staffing and pre-bussing should scale to that curve so tables reset faster during the tightest thirty minutes.
The Bottom Line: Match Inventory to Party Size
Lunch-rush seating math is governed less by how many seats exist than by whether those seats match the sizes of parties actually walking in. When a Chinese buffet in Argyle serves a 12:30 window dominated by parties of two, a floor built from four-tops leaves roughly half its capacity structurally idle. That gap is the four-top vacancy problem, and it explains the common contradiction of a growing waitlist beside visibly open tables.
Seat occupancy rate, not raw seat count, is the metric that matters. Operators who track party-size distribution and reconfigure inventory to fit it, splitting rigid four-tops into paired two-tops and holding a few larger tables for the minority of bigger groups, convert latent capacity into served covers without adding a single square foot of floor space.
Recommendations should follow data rather than instinct. Log party sizes hourly, model seat occupancy against table turnover, and pilot reconfigurations within defined windows before committing to capital changes. Over time, this turns the floor plan into a forecast-driven asset rather than a fixed cost. Restaurants reviewing their own China buffet Argyle seating performance can apply the same discipline.
Match the table mix to the party sizes that actually arrive, and the room stops wasting seats.